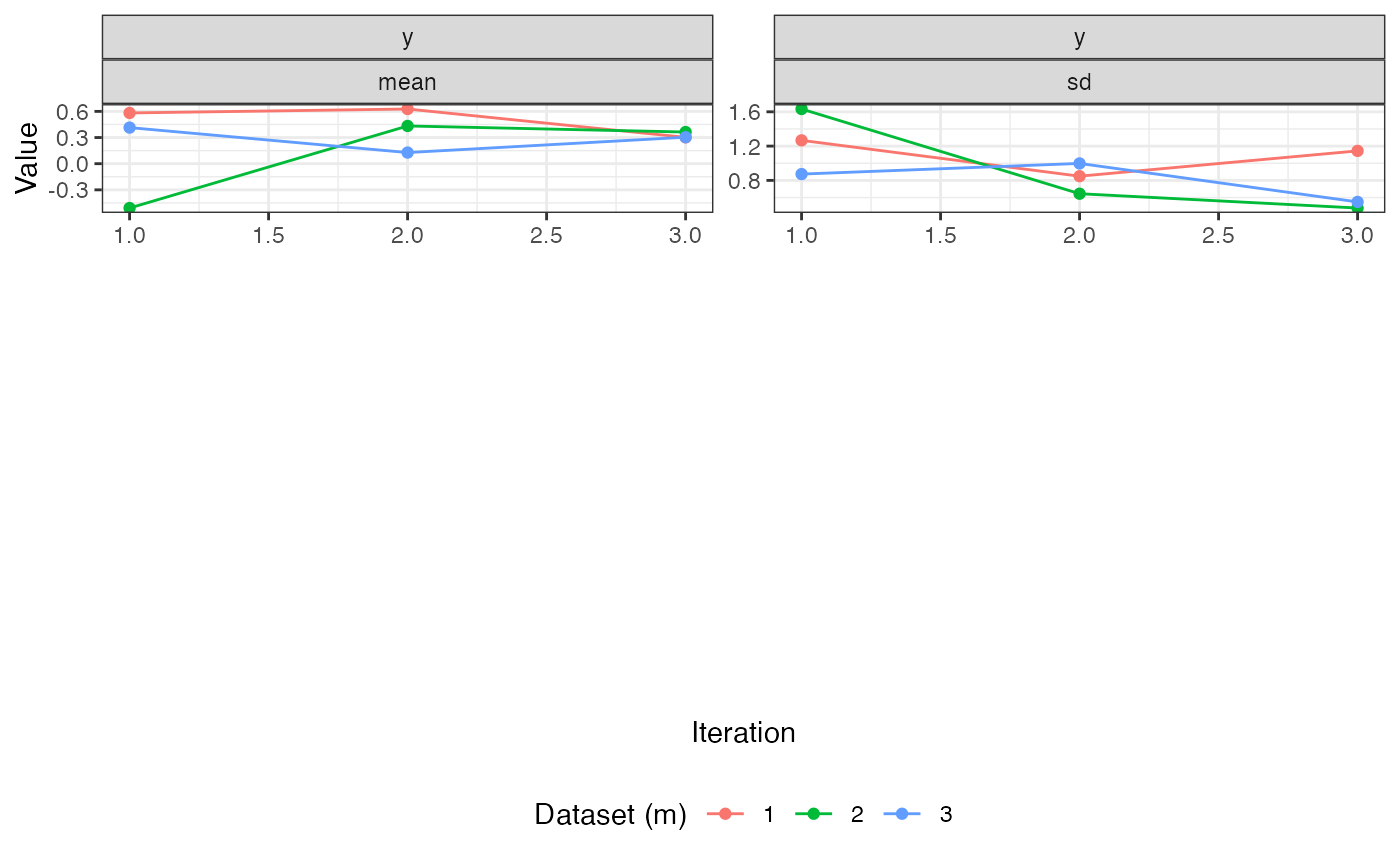
Plots the mean and standard deviation of imputed values across iterations for all incomplete variables, paginated in grids of up to 3 variables per page. Stable traces that mix well across datasets indicate convergence. Note that trace statistics are only computed for continuous and numeric binary columns – categorical and ordinal columns are excluded automatically.
Arguments
- misl_result
A list returned by
misl().- ncol
Number of columns per page. Default
2.- nrow
Number of rows per page. Default
3.